Recently there has been an upsurge of concern about a house price bubble in the UK. New Governor Mark Carney has made soothing noises about the existence of one.
Recent developments in econometrics allow us a new test which might be able to shed some light on this; it also tantalizingly allows us the possibility of a ‘real time’ bubble dating model.
The tools are, to be technical for a moment, ‘Right Tailed Augmented Dickey Fuller’ tests. They are new, and still being refined and evolved. For some discussion of them and their use see the originating papers by Phillips et al (Phillips, P., S. Shi, and J. Yu, 2013. Testing for Multiple Bubbles 1: Historical episodes of exuberance and collapse in the S&P 500. ; Phillips, P., Y. Wu, Y., and J. Yu, 2011. Explosive behavior in the 1990s Nasdaq: When did exuberance escalate asset values? International Economic Review, 201, 201–226. ; Phillips, P. C. B. and J. Yu, 2011. Dating the timeline of financial bubbles during the subprime crisis. Quantitative Economics, 2, 455–491.)
See also work on the Colombian housing market ( Testing for Bubbles in Housing Markets: New Results Using a New Method JE Gomez-Gonzalez, J Ojeda-Joya, CR Guerra ) ; on the HongKong market (Yiu, Matthew S., Jun Yu, and Lu Jin. “Detecting bubbles in Hong Kong residential property market.” Journal of Asian Economics (2013)) ; on the German market (Chen, Xi and Funke, Michael, Renewed Momentum in the German Housing Market: Boom or Bubble? (June 27, 2013). CESifo Working Paper Series No. 4287)
These papers all give detailed discussions of the test. A program for eviews is available (see http://davegiles.blogspot.ie/2013/08/right-tail-augmented-dickey-fuller.html ) as is one for Matlab (see http://sofie.oxford-man.ox.ac.uk/sites/sofie/files/omi_wysiwyg/177/21_JunYu_15.pdf ).
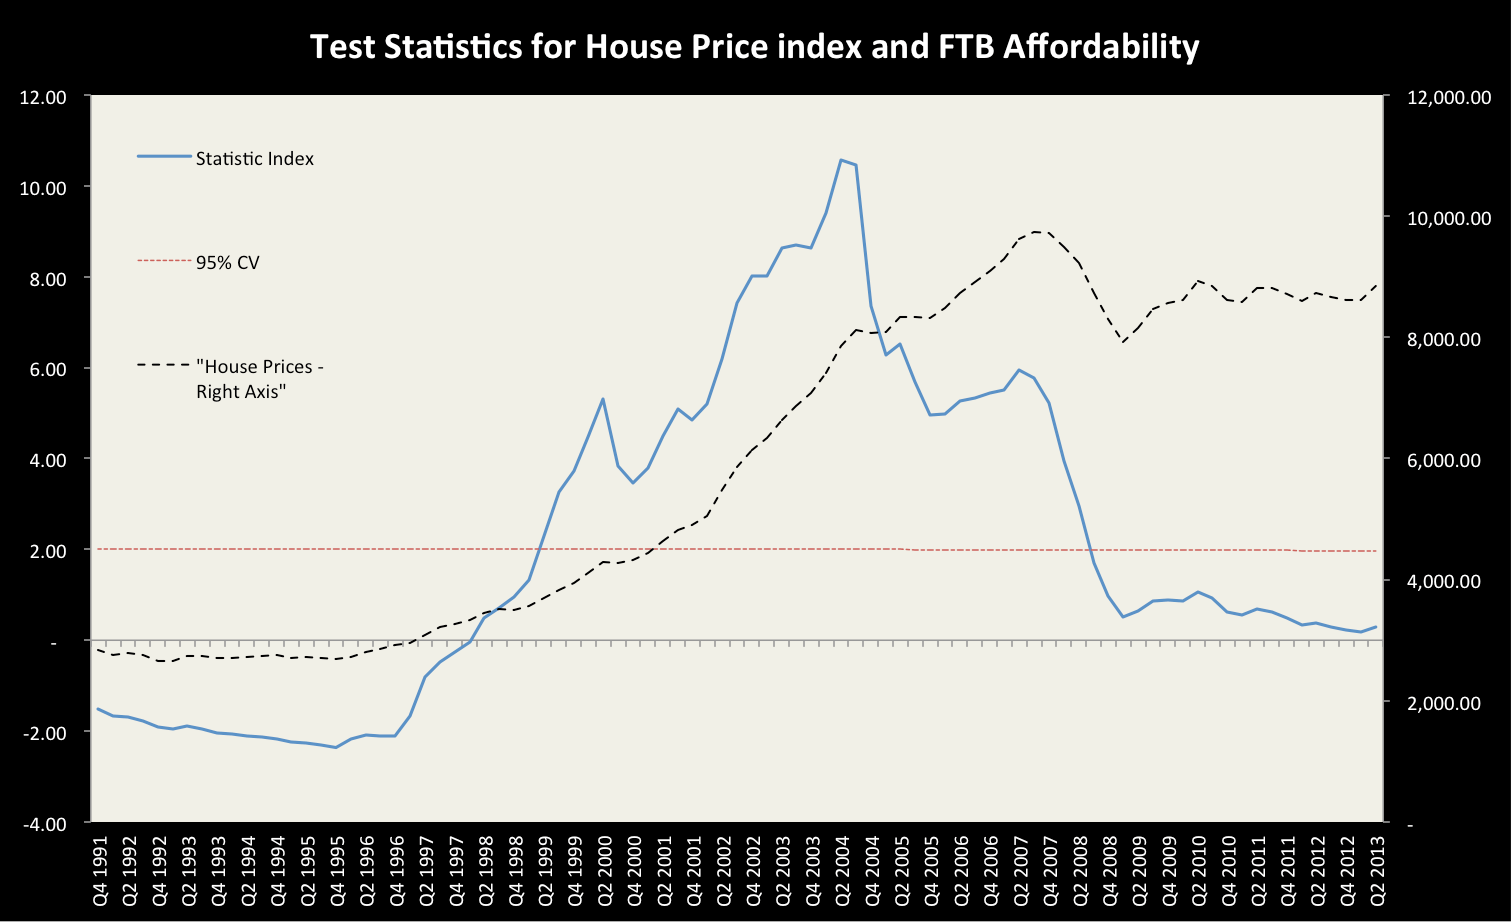
To implement this one proceeds to run the tests and to extract the SupADF statistic series.
One then looks for the existence and the date of a bubble by looking at when and if the test statistics exceed their statistical critical value.
Below see two graphs. The first is the UK housing market, defined as the Nationwide All homes index. Overlaid is the Nationwide First Time Buyer Affordability index. The second is the test statistic which indicates a bubble starting in md 1999 and terminating in late 2008. While there is a slight uptick in the statistic for q2003 it is still well below its critical value and has been on a downward trend. This suggests, no more, that at present there is not a bubble; it does not suggest that vigilance is not needed.
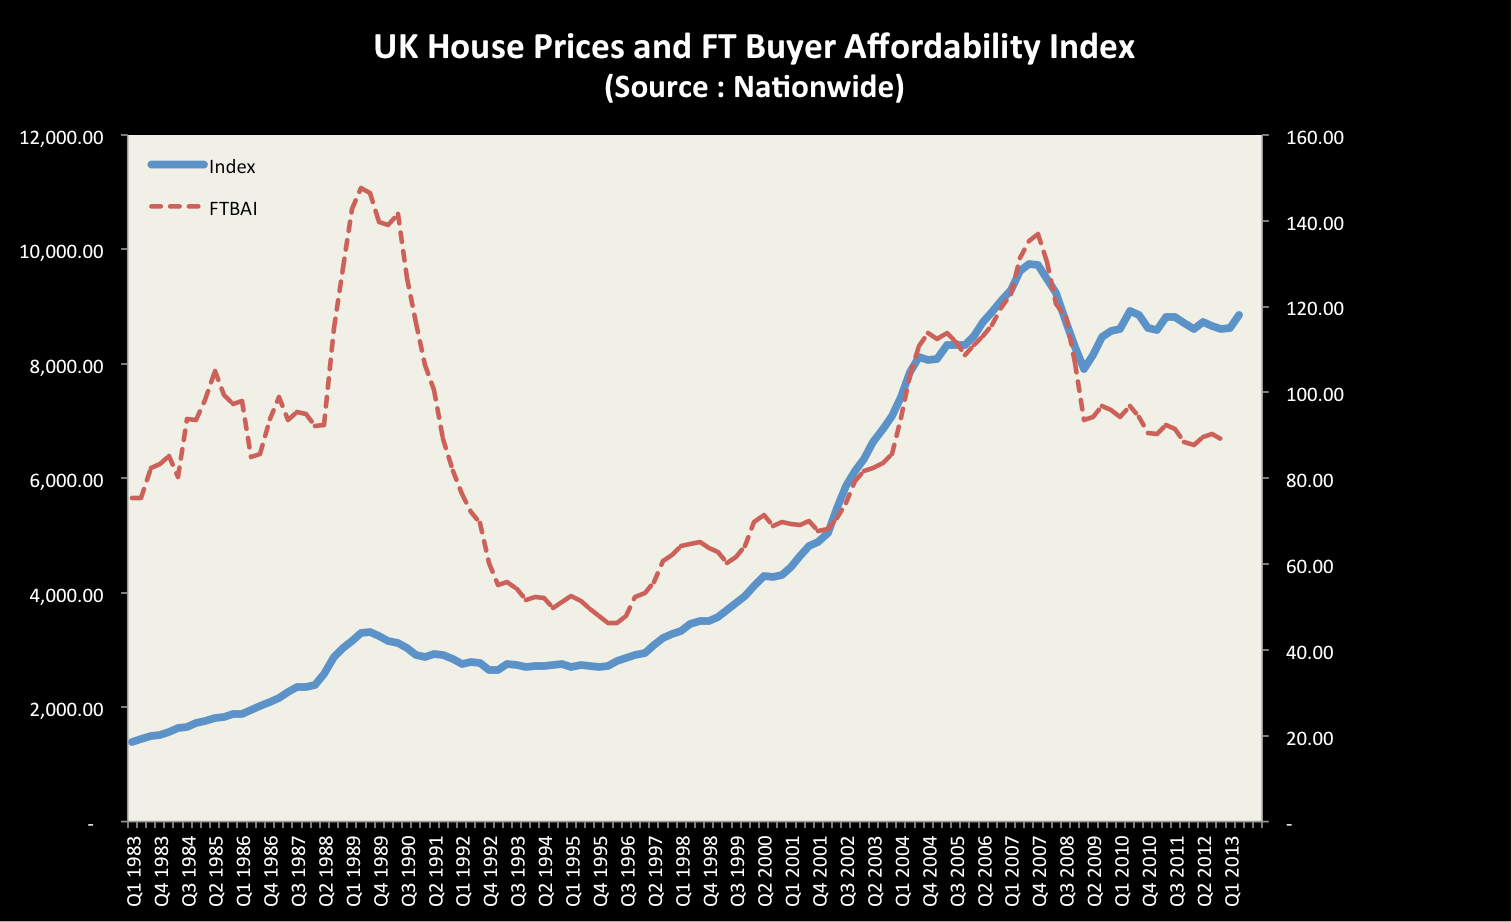
and
Leave a Reply to Frances CoppolaCancel reply